Quantcast
Channel: Scrum Tools – Agile Pain Relief

12 Easy steps for generating Index Cards from your Sprint Backlog

0
0

So you’ve captured your sprint backlog in Excel and want to print out Index cards for use on your task board. (I know many will tell you not to use Excel in the first place – I won’t). Your in luck its not all that painful.

The trick – don’t try using Excel. Instead use Mail Merge and Word (my menu hints are for Word 2003 – ymmv):

  1. On the Tools menu, select Letters and Envelopes, Mail Merge. In Word 2003 the Mail Merge Wizard will appear on the right hand side (same location as the help appears). 
  2. Select the Labels radio button. (Click Next) 
  3. Click on the Label Options… and choose either a standard label size if one fits your needs or create a custom size (mine are 3" by 4"). (Click Finish) 
  4. If your not printing on perforated Index cards – Add Borders this will make it much easier to cut resulting cards. On the Table menu select Table Properties and click on the Borders and Shading… button (on the table tab). Pick your borders. 
  5. Click Next: Select recipients 
  6. Use Existing list and browse to Excel Sprint Tracker (you could use any other datasource that Word recognizes). 
  7. Choose the work Sheet and select the rows to include. 
  8. Click Next: Arrange your labels 
  9. Under Arrange Labels choose More Items… – this will give you an ugly list (F1, F2, F3 etc) which corresponds to the columns in your spreadsheet. In my case I insert F2 (Task Description) and F3 (Estimated Hours). 
  10. Add pretty text and formatting you need to the first label and click Update all Labels button. I suggest that you make the task text big (20 pt perhaps) so its easily readable on the corkboard. (I can make the estimates appear on the right but haven’t found a simple way of forcing to the bottom of the cell). 
  11. Click Next: Preview Labels and then if all looks good complete the merge. 
  12. Either Print… directly from here or do the Edit Individual labels…

With all the time you save – look me up at Agile 2007 and buy me a pint.

Be Sociable, Share!

Tools, Tools, Tools

0
0

As software developers we have this innate belief that another tool will solve all our scrum-project-tracking-whiteboard problems. To that end many agile practitioners search for a tool to track their projects for them.

However in using a tool we miss the benefits of cards posted on a whiteboard/corkboard in a public place.

Let’s compare the options

Whiteboard/Corkboard Electronic tool
Daily Standup in front of a board keeps the team focused by reminding team members what the stories and tasks are. No screen is large enough for team members to stand around and read during the standup. Team members interact with a tool not each other.
Team members can update their progress by moving a card or changing an estimate. You must login in to the tool and find the task/story to make changes.
Anyone walking past the team area can instantly tell the status of the sprint and project. Since team members see the board frequently road blocks will be quickly spotted. You must login to see the status of the sprint/project.

In short the whiteboard/corkboard promote conversations and collaboration among team members. If your management insists on seeing pretty reports and charts on their computer then challenge your management.

  • These reports are waste – they don’t get shipped to the customer.
  • Invite management to visit the team room on a regular basis and see the progress themselves.
  • Have daily Scrum of Scrums that management attends so they can get their status fix that way.

If all else fails then treat these reports as an impediment that can’t be removed. Insulate the team from it – don’t force them to use a tool just because someone else wants a report. Instead as ScrumMaster/Facilitator generate the report from the taskboard.

Distributed/Dispersed teams (ie no shared physical environment) are the only time where I see a good argument for the use of tools. Even then I would try the simplest possible solution first: Google spreadsheets. It allows everyone on a team to collaborate on editing a spreadsheet at the same time.

Update: I should’ve stated my conclusion more clearly. Electronic tools work can be made to work, however I believe that you’re giving up an opportunity to foster interaction and collaboration among your team members.

Be Sociable, Share!

Stable Teams Really Do Matter

0
0


impact-smallFor years now Rally has been performing a large ongoing experiment on the Agile world. As a side effect of providing one of the better known tools they’ve managed to see a lot of data accumulate about what makes an effective Agile team. In a report called “The Impact of Agile Quantified” they’ve sanitized the data and then run some statistical analysis on it. 

Here’s what they saw:

  • Dedicating Team Members to one team doubles productivity, reduces variance throughput and leads to a small reduction in defects. They note that this is a fairly common practice among teams.
  • Stable Teams – keeping a team intact for the long term resulted in 60% more productivity; teams were more predictable and responsive.
  • Limiting Work In Progress – reduces defect rates; however, if your WIP limit is already low, reducing it further might affect productivity.
  • Relative/Story Point Estimation[1] – They divide the world into teams that: A – Don’t estimate; B – Estimate Stories in hours; C – Estimate Stories in Points – tasks in hours, and D – teams that only Estimate using Story Points (i.e. teams that have dropped task hours). Their discovery – the teams (A) not using estimates had 2.5 times as many defects as the teams (C) using Story Points and Task hours. An additional surprise – teams (C) using Story Points and task hours had fewer defects than (D) teams only using Story Points. Some of the discoveries in this one could use further investigation.
  • Team Size 7+/- 2 – the findings suggest that teams before the Agile norms are more productive, but have a higher defect rate and reduced predictability, whilst larger teams were more predictable. The authors note that the larger teams typically also used “Story Point Estimation for Stories and Hours for Tasks” – this might explain some of the productivity differences. The authors recommend sticking to the traditional recommendation of 5-9. Before switching all your teams to 3 people or less – which is tempting with the promise of more productivity – also consider the effect on the work if even one team member leaves. This is another datapoint that bears digging into.

I was surprised to find that stable teams are less frequent among the Rally customers than my own. Rally noticed that 1 in 4 people changed every 3 months. Experience at my regular clients suggests that it should be less than that. No matter what the frequency, we have to appreciate that every change is expensive; both in terms of the knowledge lost and the consequent slowdown while team members renegotiate their relationships. It’s hard to build the high performance teams that we all seek when we have frequently changing membership.

As with any set of measures, I think the value isn’t so much in the number as the signal regarding what to look at in our teams. In addition, I suspect some high performing teams will probably be doing things that don’t show up well in the larger dataset. For instance, I’ve seen many high performing teams with less WIP than the number of team members. Instead they swarm all work, etc.

The report from Rally is well worth reading, although it’s sixteen pages long. (You will have to give away your email address).

To my friends at Rally, there are many interesting questions to be asked here. If we look only at stable teams – what do we learn about team size? If we look only at mature teams (>1 yr old and stable) – do any of our discoveries around team size and estimation change? What about time to fix defects vs. productivity or quality? What about time to fix defects vs. team size? Story size vs. productivity vs. defects? Distributed teams’ productivity? What about the highest performing teams – what where they doing…? Have you considered releasing your dataset to the rest of the world so we can help you mine it? Two reasons: more eyes will spot more ideas and the Agile ideas have always been developed and evolved in an open fashion. Perhaps you could release with the rule that anything someone else discovers from it has to be shared openly.

Hat tip to Dave Nicolette who first pointed this paper out to me


[1] In the paper this is referred to “Full Scrum” – which is odd since Scrum doesn’t require Estimation at all.

Welcome to the High-Performance Teams Game

0
0


High-performance Team Game for Scrum/AgileYour team is working on the World’s Smallest Online Bookstore, a site that provides the best results (just a few) for every search, not every result on earth. We’re a vulture capital funded company, so if we don’t deliver, our funding will be cut.

So begins the opening of the High-Performance Teams Game.

My goal is to help you see the effects of choices/tradeoffs on productivity and team cohesion. While some of the benefits of Agile happen at the individual level, there are many things that affect the relationships between team members, and therefore the overall cohesion and productivity of the team.

The game is played by a team of 5-9 people, in a series of  5-6 rounds. During each round there is a little bit of teamwork, a little bit of discussion of the science, and some game play. Each round represents 6 weeks, or three 2-week sprints. In each round you have budget for the amount of work/stuff you can do based on your team’s capacity. Some of that budget must be spent on delivering features, otherwise the business will threaten to let you go. Some of it should be spent on growing the team and their engineering skills, otherwise you don’t get more budget capacity.

Some of the leading research [1][2] suggests that a key requirement for high performance teams is Cohesion. Cohesion is a measure of the strengths of the relationships between individual team members.

In this session we will use this research to discover:

·      Simple communication patterns we can monitor to spot the health of the team.

·      Simple tools we can use to measure and track those patterns.

·      What effect does the location of the watercooler have? What effect do lunch tables have?

·      Can cohesive teams get you into trouble?

·      The importance of dissent and diversity within teams.

·      Bonuses – the negative effects of individual bonuses are well understood by the Agile community. However, we’re left with the question: Are there good bonuses?

Downloads Available

Game Material (Dropbox folder):


Facilitators Material:


In addition to the game material, I’ve written a paper on the “5 Steps Towards High-Performing Teams”.

Enjoy playing with your team.
Creative Commons License
High Performance Teams Game by Mark Levison – Agile Pain Relief Consulting is licensed under a Creative Commons Attribution-ShareAlike 4.0 International License.


Feedback from GOAT (Gatineau Ottawa Agile Tour 2015): During game play at the conference, only the facilitator knew the benefit/effects of each action while the game progressed. As a result, in the 90 minute session some teams had a difficult time keeping track of the calculations. Future editions will reveal all the calculation details on paper to the attendees in the round after they’ve played.


[1] Sandy Pentland – The New Science of Building Great Teams
[2] Ben Waber – People Analytics


Forecasting, Metrics and the Lies that a Single Number Tell Us

0
0

We’ve previously seen that our mental models often make false assumptions due to cognitive bias. Giving a Single number in a report has a similar problem.

The classic Agile number is ‘Velocity’: the average rate at which your team delivers work. It is often shared as just one number. E.g. our team achieves 20 pts a Sprint.

You’re walking and come to a river – there is a sign that says the average depth is 1 foot. Can you safely walk across? You don’t know. For most of its width, the river may be only 6 inches deep, but for a critical 1 foot stretch, it’s 6 feet deep. Not safe to cross.

You’re told the average grade on a test in your class is 75%. What does this tell you about your own mark? Nothing.

The problem with reporting velocity as a single number is that it implies the average number will continue into the future at the same rate. It implies that there will never be any variance.

Consider reporting a range[1][2].

  • Best three sprints in the past year – this is the highest you’re likely to achieve
  • Last three sprints – you’re 50% likely to achieve this number
  • Worst three sprints in the past year – the least you’re likely to achieve

Forecasting Metrics burndown

Along with projecting a cone of uncertainty in your burndown/burnup/cumulative flow diagram, it can also be used to illustrate which items in the product backlog are more or less likely to be achieved by drawing lines in the product backlog.

If you need a more sophisticated model than these, consider using a Monte Carlo simulation. Larry Maccherone has a Chrome only example: http://lumenize.com/ and code showing how he uses it: https://jsfiddle.net/lmaccherone/j3wh61r7/.

Forecasting Metrics confidence lineWith five Sprints to go, we have a clear picture of where in the product backlog we will likely get.

So instead of forecasting a number, now we’re forecasting which items will be delivered, i.e. we’re forecasting value. This drives a better quality conversation because we can have real discussions about which stories or features to sort into which part of the Product Backlog.

This brings up the final problem with velocity as a number (or even range). The number of Product Backlog Items, Features, or User Stories don’t necessarily correlate with how happy the customer is. A small feature may delight the customer if it’s done well (example: ability to freeze the first row in Excel), while a large feature (example: SmartArt in Word) may not make the customer(s) happy.

So even with ranges and probabilities, the use of numbers can still hide the most important thing: Is the customer happy?


Image attribution: Agile Pain Relief Consulting

[1] Note that even this model of reporting velocity has an implicit bell curve behind it.
[2] Even elections are now forecast with ranges by the better forecasters: Eric Grenier: http://www.threehundredeight.com/2015/10/final-federal-projection-likely-liberal.html


Measurement for Scrum – What are Appropriate Measures?

0
0

We’ve seen the risks of assuming that everything is normal distribution, and also the problem with reporting a single number. What else do we need to be aware of? What can we usefully measure?

Risks in Measurement

Many important things can’t be measured using formal measurement systems. As a result, not enough attention is paid to them. For example, Technical Debt – there are some attempts to measure code complexity but they don’t work well, so organizations sweep the problem under the rug until a code base becomes too complex and expensive to maintain. One of Nassim Taleb’s key points is that Black Swan events couldn’t have been predicted by mathematics before the event, however they look obvious in hindsight. Only better questions will help spot a risk in advance.

Always consider how your metric will be gamed. “Tell me how you measure me, and I will tell you how I will behave” – Eliyahu Goldratt[1]. People will do what it takes to meet what they believe they’re being measured on, so we should only use metrics that, if gamed, we would be happy with the result. Example: if we measure Velocity (number of Story Points per Sprint), teams will rapidly find ways of inflating their Velocity (estimate higher, reduce effort on testing, etc.) in ways that produce a weaker product.

People will do what it takes to meet what they believe they’re being measured on.

Focus on a change or trend, and not the raw number itself. A change in a metric is just a hint to go look and see. It doesn’t, in and of itself, tell us anything. For example, Unit Test code coverage (expressed as a percentage) goes down over the course of one Sprint. This may be bad – perhaps new code was introduced without accompanying Unit tests. Or it may be good – well tested code that was redundant was eliminated. So a metric is just a hint to have a conversation.

The Six Sigma[2] manufacturing process makes significant use of metrics to reduce defect rates by eliminating variability. But applying that same approach to software and product development would have a disastrous effect. Knowledge work, e.g. the work of building products (software or otherwise), is hard to measure because the nature of the work is inherently variable. What’s the standard time to implement a feature? There is none. How long does it take to fix an average bug? There are no average bugs. When measuring, we need to be careful not to use the measure to eliminate the variability inherent to the work.

And then there’s Vanity Metrics. Be careful of metrics that measure things that the customer doesn’t value. LeanKit shows that focusing on 5 ‘9s’ (99.999%) up time might cause us to put energy into solving the wrong problem. In the LeanKit example, 5 ‘9s’ is the goal, and when customers complain about downtime, the DevOps person notices that 75% of the down time occurs when the nightly maintenance scripts are run. So they put time into improving the scripts to eliminate the problems, but the customer complaints don’t go away. Yes, the complaints were about the percentage of downtime… but about downtime during the day! Focusing on the evening downtime misses the point. In another case, American Airlines has promised a response to customer complaints within 20 minutes. However, many of the responses are clearly canned e.g. if you mention power supply problems on a particular plane, you’ll get a response back that suggests that other people in your row might have been using the power, along with a link to the airlines FAQ. Instead of a useless response within 20 minutes, what the recipient really wanted was to know that maintenance had been sent a ticket for the problem.

Recheck your metrics frequently (at a minimum, every 3 months) and ask if they’re still relevant. Ask if they’re still helping to drive change. Drop metrics that are no longer helping.

When considering effective metrics, ask:

  • How will this measure help our customer?
  • Does this measure have a “best before” date?

How will a smart team game this metric? (And if they game it, will we be happy?)

Potential Measure What is it trying to measure? How does it help? How will it be gamed?
Other concerns?
Defects that escape the Sprint Quality It sends a strong signal that zero defects is desirable. People might argue about whether an item is a defect or just a new User
Story.
Static Code Analysis (e.g. tools like Sonar and FindBugs, PMD) Quality by doing static analysis Static analysis tools can spot small mistakes in code and warn developers of potential bugs. Static analysis can give people a false sense of security since the tools only check for bugs that can be proven by examining the code – they don’t check for logic, implementation or intent errors. Tools are often used to summarize health with one or two numbers. As usual, the number is useful if it tells you to roll back the covers, but risky if you assume it means an area of your code base is safe.
Test Coverage How much of the code is visited by automated tests (unit or acceptance tests) It can help spot untested or even unused code. People often assume that code visited by a test has been tested. All a test coverage tells us is the code was used by a test. It shows nothing about whether it was tested.
Customer Satisfaction measured via NPS (Net Promoter Score) Whether the customer would be happy to recommend your product to their friends on a scale of 1-10. They’re then asked why they choose that number. Are you delighting your customers? It can only be measured infrequently, so information arrives a long time after your work has been done. It doesn’t correlate well to the product work your organization has done. The power is in the answer to the “why” question.
Team Member Happiness Each Team rates their happiness with the Team or Organization on a scale of 1-5. Happier people are more productive and focused. Jeff Sutherland has correlated Happiness with an increase Productivity and Revenue. When a team member’s happiness dips it can be a warning sign that something we’re doing is harming our organization. Happiness can sometimes become a trap – a team’s productivity plateaus and they’re happy.
Cycle Time
Cycle Time How long it takes an item to production from the moment the team starts working on it. Work in Progress – whether it’s in development, test, documentation or some other state delivers no value to the customer. Work only delivers value when the customer has it.
Lead Time Length of time from the moment the idea is received to when it is delivered to the,customer. Also takes into account the time an item sits waiting in a queue (Product Backlog,or otherwise before the team works on it).
Interruptions
Interruptions How many times during the Sprint the team(s) have to deal with… Creates awareness around the rate of interruption for the time.
Support Issues …a support issue Highlights either quality (product bugs) or usability issues (feature isn’t used as the team intended).
Non-Product Backlog work requested …work items that didn’t come from the Product Backlog Highlights quality work that is bypassing Product Ownership and Portfolio Management.
Other Interruptions … interruptions that are not part of the previous categories Highlights Dark Work and other things that are distracting the team
Dangerous Measures
Velocity Average number of Stories or Story Points completed per Sprint Can be used to forecast when a feature will be released. It can also help a team spot long-term trends in their own work. It is often misused to compare teams or measure productivity, which leads to a culture of velocity above all else (especially quality). If used, it should be used by only the team itself.
Bug/Defect Count Number of Bugs logged in on the bug tracking system A measure of quality At best, measure defects in quality on the surface of the system. Missing:
– Doesn’t measure the internal quality of the code
– Never complete since we will never find all the bugs
– Stale Bugs that can be reproduced or are in parts of the system that are no longer used cloud the measure
Return on Investment Revenue per Feature divided by Cost Can’t realistically be measured.
Productivity Can’t be measured, and if it was, it’s unclear how it would help guide teams.
More Potential Measures
Ratio of Fixing Work to Feature Work Measure very roughly the amount of time spent on fixing bugs vs new feature work. This shouldn’t require tracking hours, we want a rough ratio. Helps us understand where effort is being spent. Helps a PO make better decisions about where they’re spending their money.
How long does it take to test end to end? How much testing would it require to have confidence in release? Reminds us of the overhead/tax we need to pay before releasing our product on the world. Since it’s part of cycle time, we should feel pressure to reduce this from days to hours.
Release Frequency How much time between releases? Reducing time between releases can help us get paid more often.
Backlog change rate How often are Product Backlog items added, removed, reprioritized, etc? Too little and we should be concerned that we’re not building the product the customer wants. Too much and we should be concerned about our ability to build a stable product.
Skills Matrix/Team Learning A skills matrix is a tool to help the team understand where it has a lot of knowledge and where it is weak. To measure, just look for where we have changed in the last period of time. It can help nudge people to spend some of their learning time in a specific area where the team is weak. If team members perceive they’re personally being measured on this and this measures ties to their performance review/pay, they inflate their self-rating. So rate of change in Skills Matrix or Team learning is only useful if it is used by the team for their own needs.
Cross Team Dependencies The number of things that one team needs from another team. The more things we need from other teams, the less freedom we have in prioritizing work (lead time is increased, etc.) The measurement allows us to spot the kinds of dependencies we suffer from. If we haven’t already, this
measure should force us to discover Feature Teams. And if we have, it should force us to invest in skills where we still depend on other teams.
Number of recent experiments run Count the number of experiments run since the last measurement. Agile Organizations are continually challenging the status quo. Counting the number of experiments can act as a reminder to run them and measure the results. Experiments for the sake of experiments is also bad, so the trend doesn’t matter as much as being reminded to run experiments.
Unfinished Stories, aka Adherence to Definition of Done How many Stories at the end of sprint didn’t meet the definition of Done. Helps by forcing team members to focus on getting fewer stories to truly done every sprint. By splitting stories into smaller chunks, teams are less likely to have unfinished work. This usually results in greater flexibility for the Product Owner and better throughput – so gaming this measure is a good idea.
Stories that have been Deployed How many Stories have been deployed? It forces team members to focus on getting small chunks of valuable work to production where we make money.


As Nassim Taleb points out, the best measures still won’t measure your biggest risks. Risk registers are popular, but since their construction isn’t scientific, they suffer from cognitive biases[3][4].

Some guidelines to help with measurement:

  • Assume all measures will be gamed.
  • Measure the simplest things that might help.
  • Fewer measures create simpler systems and simpler systems create less complex solutions.
  • Usually the real story is hidden behind the measure, and the measure was just a hint about where to look. Use measures to hint about what questions to ask.
  • Don’t measure performance, measure outcomes.
  • Assume all measures eventually stop delivering value and should be dropped.
  • Don’t burden your team members to collect your measurements.

In general, Scrum favours qualitative over quantitative measures. Measurement doesn’t replace watching and listening.

What other measures have you tried? What effect did they have and how could they have been gamed?

Other good articles on measurement:


Definition of Done vs. User Stories vs. Acceptance Criteria

0
0

Definition of “Done”

The ScrumGuide says that:

“When a Product Backlog item or an Increment is described as ‘Done’, everyone must understand what ‘Done’ means.”

I can promise you, that sentence and the paragraphs that follow are the most poorly understood aspects of the ScrumGuide.

The definition of “Done” exists to ensure that the Development Team agree about the quality of work they’re attempting to produce, whereby “Done” becomes a checklist that is used to check each Product Backlog Item (aka PBI) or User Story for completeness. When Scrum is used as intended, “Done” is our tool for ensuring that we’re ready to release at the end of every Sprint (minimum), or continuously through the Sprint (modern preference).

The goals of “Done” are:

  • to build a common understanding within the Team about Quality and Completeness
  • to be a checklist that User Stories (or PBIs) are checked against
  • to ensure the increment shipped at the end of the Sprint has high quality and that the quality is well understood by all involved.done

“Done” is structured as a list of items, each one used to validate a Story or PBI. Items in “Done” are intended to be applicable to all items in the Product Backlog, not just a single User Story.

Example Definition of “Done”:

(Simplified) from the World’s Smallest Online Bookstore

Item
Whenever changes are made to existing code, a Unit Test is written to cover that method
Usability Review Completed
Tested on iPad, iPhone and Android Phone
Performance Tests run
Code Peer Reviewed (if not written using Pair Programming)


So “Done” differs from Acceptance Criteria because “Done” is intended to be universally applicable. It also differs in that it has a formal definition, whereas Scrum doesn’t require either User Stories or Acceptance Criteria to be used, so they have none. User Stories encapsulate Acceptance Criteria.

User Story

A User Story is a tool to move the focus from What we’re building (what often happens with traditional requirements) to Why and Who. It’s intended to start a conversation between the people who will implement the Story and the Customer/Product Owner, with the goal of ensuring that the team solves the underlying business problem instead of just delivering a requirement.

The best unofficial definition of “User Story” that I’ve heard: a User Story is an invitation to a conversation.

The goals of a User Story are:

  • User Story slices, image by Agile Pain Relief Consultingto focus on the business problem that needs to be solved, not the solution to that problem
  • to start a conversation about why a problem needs solving, who needs it, and what problem to solve
  • to demonstrate a need in as concise and simple a form as possible
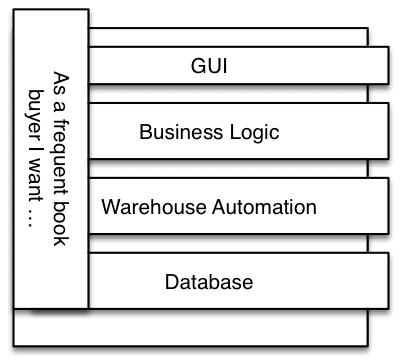
  • to be a small vertical slice of functionality through the entire system, not a description of the component layers or technical need. (As illustrated by the picture). Traditional approaches often describe work to be done in technical layers (e.g. Business Logic or Database). This leads to waste in the form of Over Production. User Stories avoid this waste by challenging teams to build only the pieces in each layer required at that moment.

A User Story is an invitation to a conversation.

Since User Stories are not official Scrum tools, there is no required format, but a common structure is “As a <role> I want <to do> so that <value>”.

The three components of User Stories, often referred to as the three C’s:

  • Card: A token (with a Story title/description), used for planning, and acts as a reminder to have conversations.
  • Conversations: Conversations that discuss the Story details and result in one or more test confirmations.
  • Confirmations: Acceptance criteria that can be turned into automated acceptance tests.  These automated tests are vital, and they are what enable the simple and light approach implemented by the first two C’s: card and conversations.
Example User Stories:

As a first time book buyer I want to find the perfect mystery novel so I can while away the time on my next plane flight.

As a frequent book buyer I want strong passwords so that my credit card information remains secure.

Each User Story (or PBI) and its associated Acceptance Criteria (which we’ll discuss next) are checked against the Definition of “Done” to ensure correctness and completeness.

Acceptance Criteria

A User Story (or PBI) is deliberately vague, allowing the precise details that will help the implementation to be discovered at the last responsible moment. Acceptance Criteria are the precise details. Some of the Acceptance Criteria will be discovered in Ongoing Backlog Refinement events before the Sprint starts, and others will be discovered right after Sprint Planning when 3-4 people sit down to have a conversation about the Story.

(For more details on the Lifecycle of a User Story and Acceptance criteria visit this article.)

The goals of Acceptance Criteria are:

  • to clarify what the team should build before they start work
  • to ensure everyone has a common understanding of the problem
  • to help the team members know when the Story is complete
  • to help verify the Story via automated tests.

So Acceptance Criteria are attributes that are unique to the User Story or Product Backlog Item.

Example Acceptance Criteria:

This User Story:

As a frequent book buyer I want strong passwords so that my credit card information remains secure.

results in the following Acceptance Criteria:

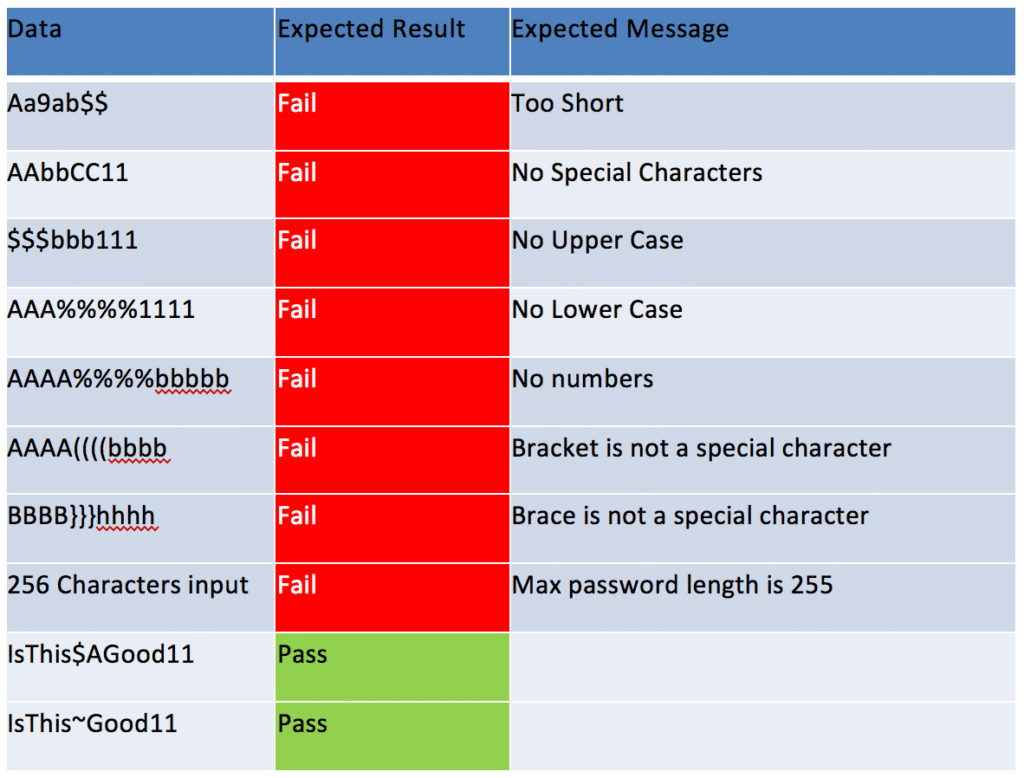
The password is at least 8 characters. The password contains a character from each of the following groups: Lower case alphabet, Upper case alphabet, Numbers Special Characters (!,@,#,$,%,^,&,*)

The trouble with Acceptance Criteria written in a plain English format, as above, is that they’re full of ambiguity. So a popular approach to describing Acceptance Criteria is “Specification By Example”, also known as Behaviour Driven Development (BDD) or Acceptance Test Driven Development (ATDD).

Story: Strong passwords
Acceptance Criteria:

Acceptance Criteria - Specification By Example, image by Agile Pain Relief Consulting

Conclusion

Definition of “Done” is the global checklist that can be applied to all Product Backlog Items or User Stories. Acceptance Criteria are the things that are specific to the individual PBI or User Story. User Story is a placeholder for conversation about User need.


Image attribution: Agile Pain Relief Consulting


Latest Images